Division 3 - 2011/12 Season
|
Division 3 League Table – 2011/12 (FINAL) |
|||||
| Team |
P |
W |
D |
L |
Pts |
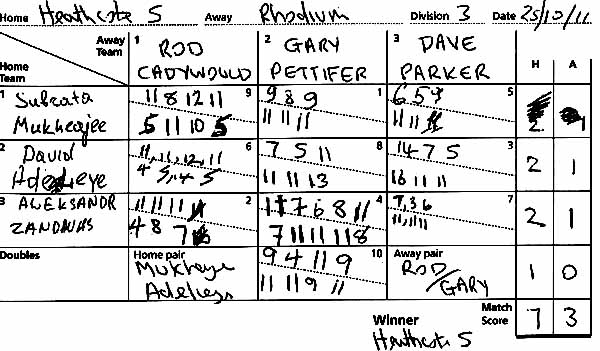
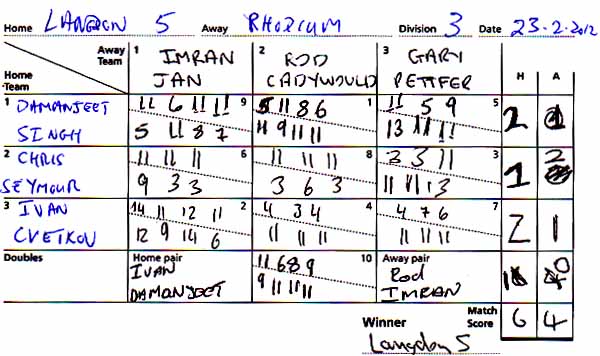
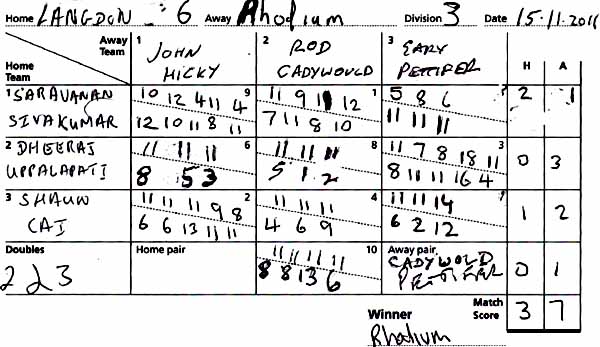
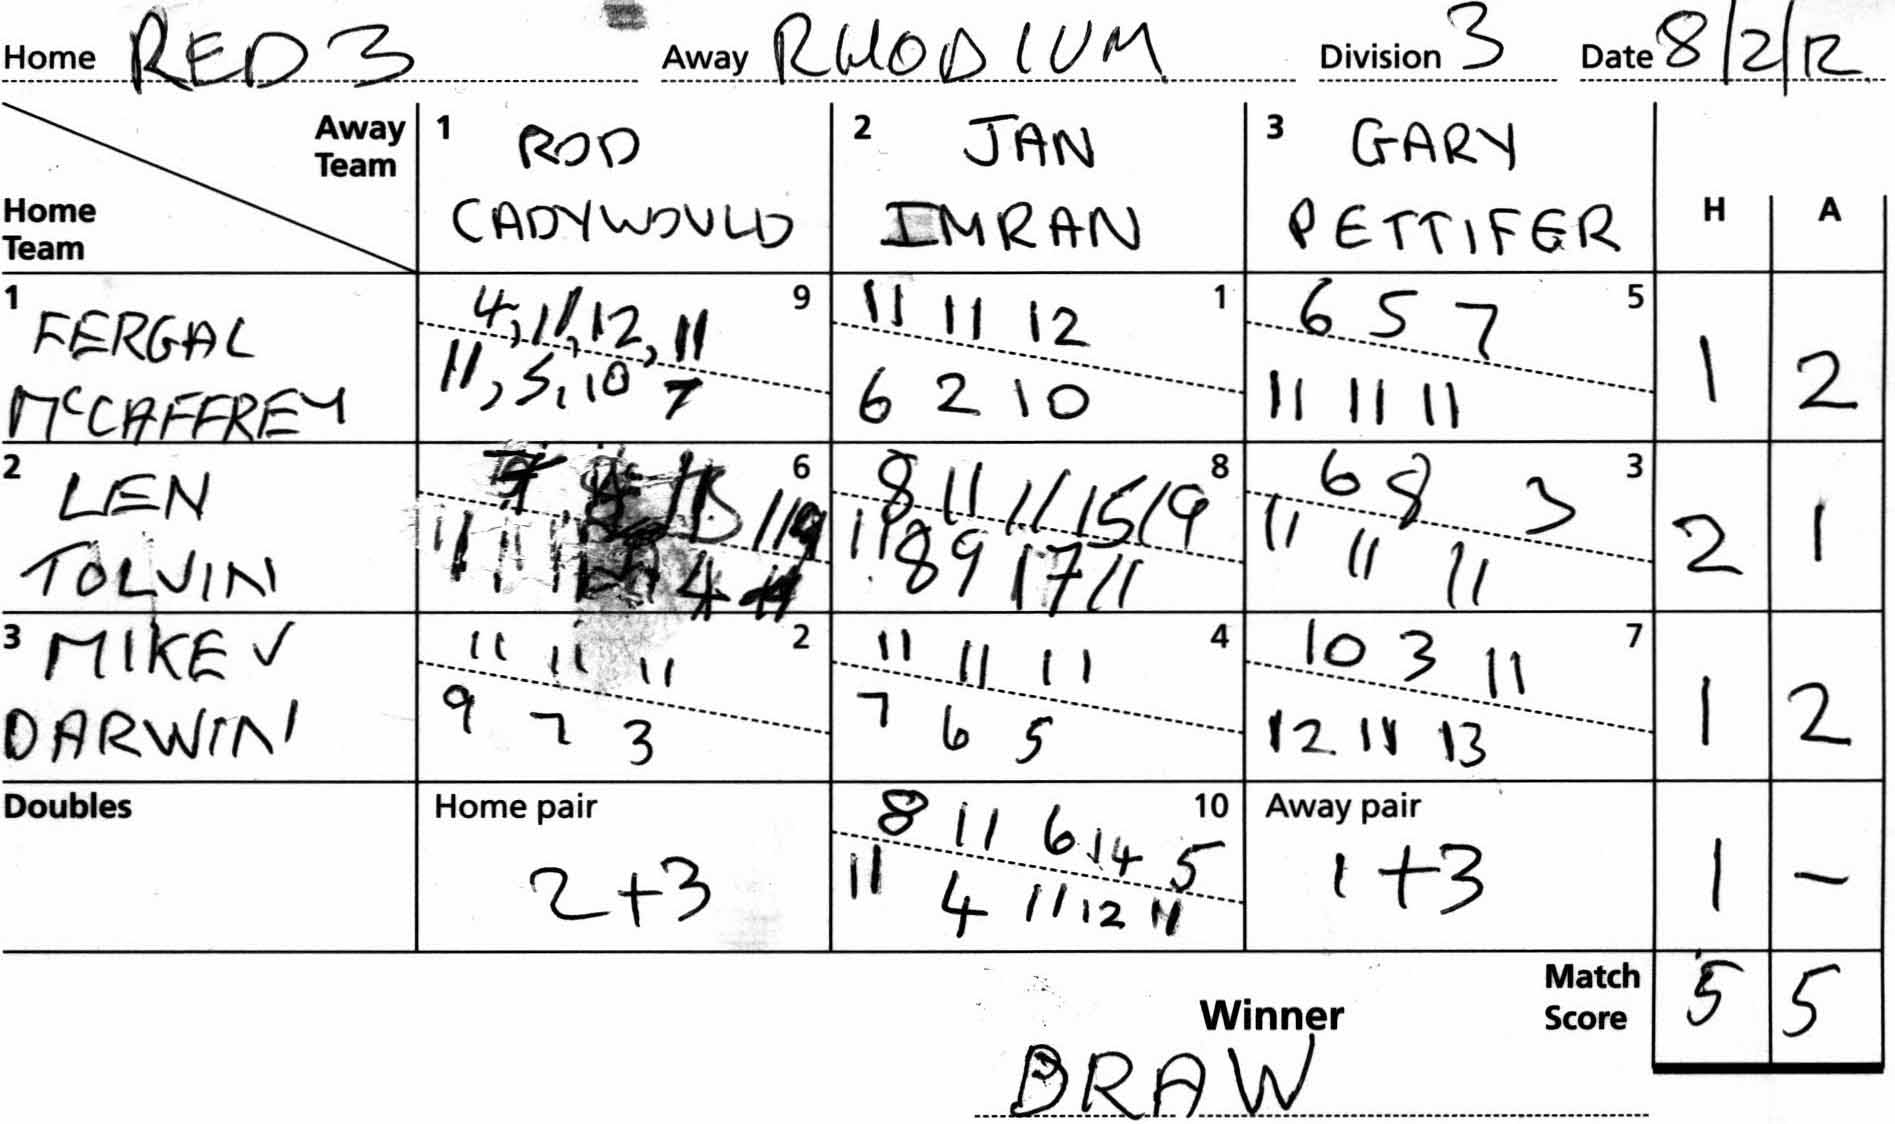
| Rhodium |
16 |
11 |
2 |
3 |
103 |
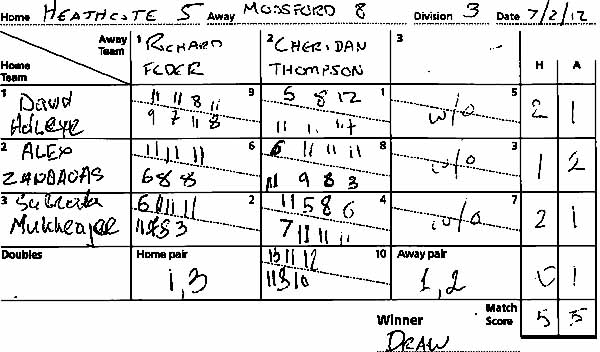
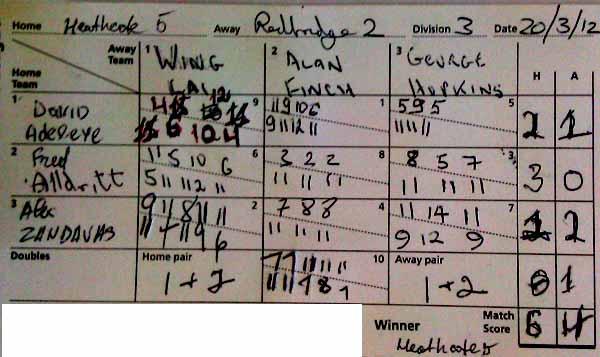
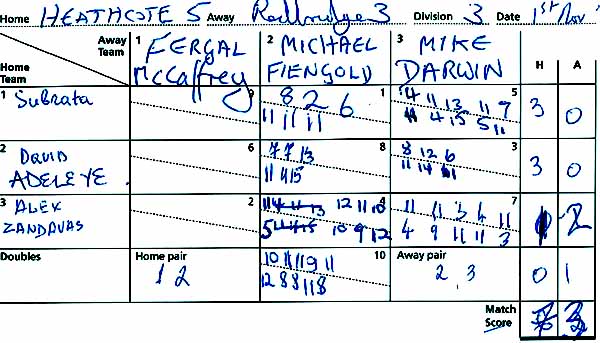
| Heathcote 5 |
16 |
9 |
4 |
3 |
86 |
| Heathcote 6 |
16 |
10 |
1 |
5 |
85 |
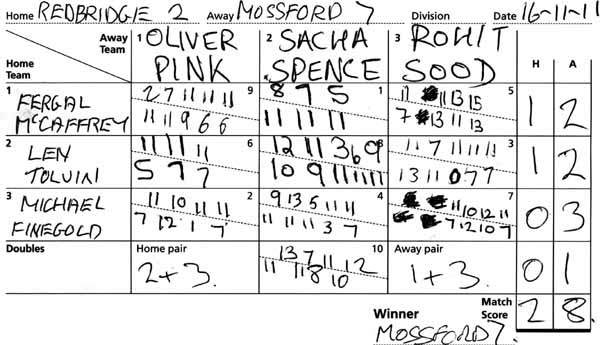
| Mossford 7 |
16 |
6 |
4 |
6 |
85 |
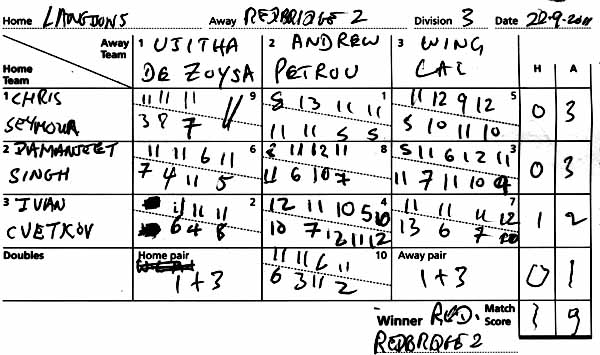
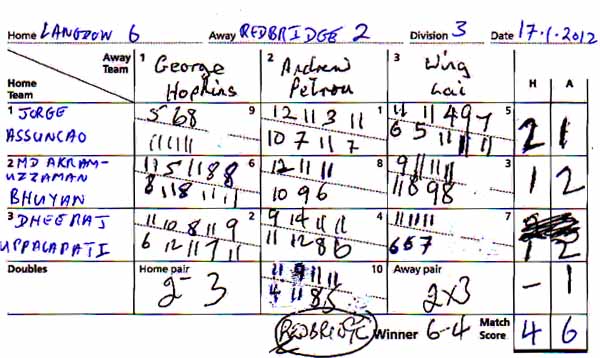
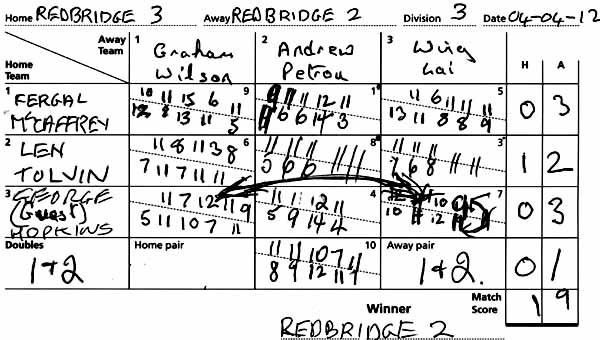
| Redbridge 2 |
16 |
8 |
2 |
6 |
84 |
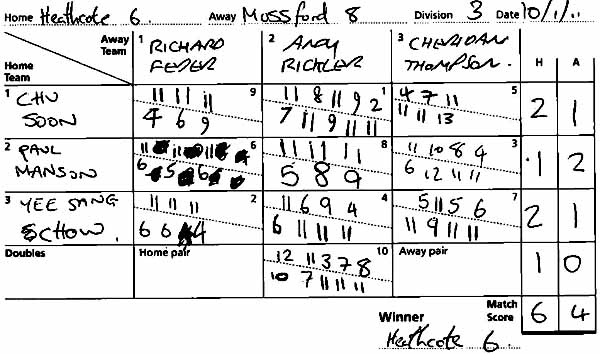
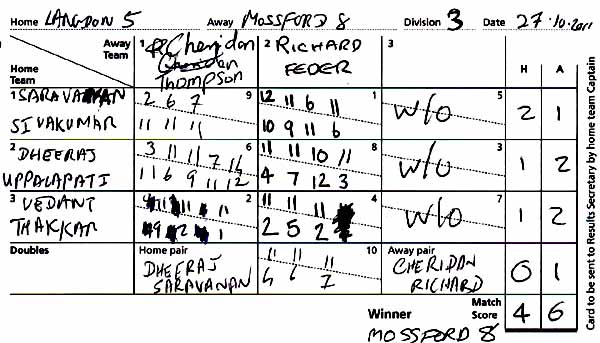
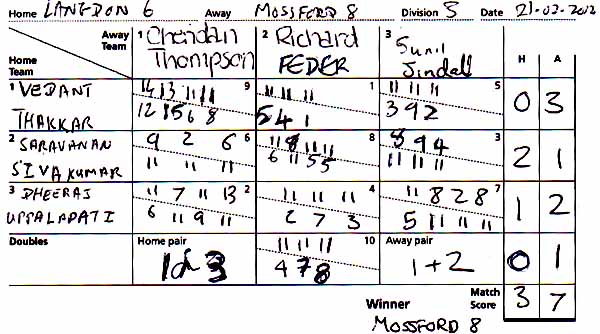
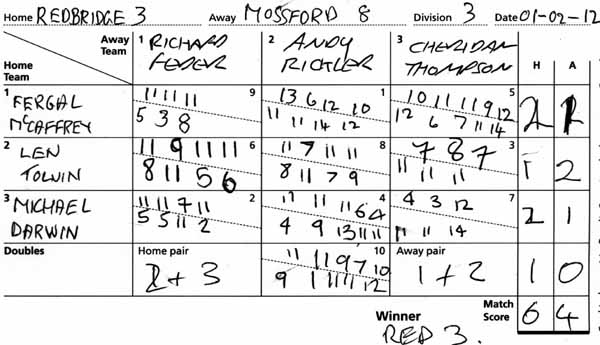
| Mossford 8 |
16 |
5 |
5 |
6 |
82 |
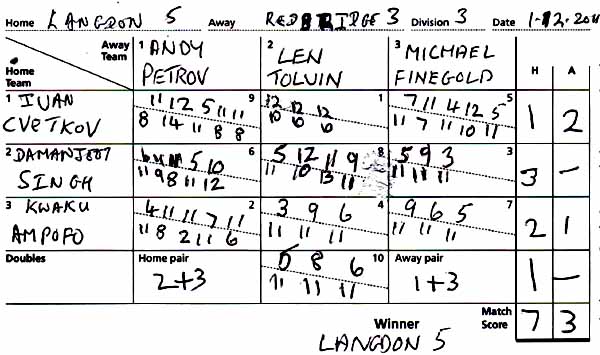
| Langdon 5 |
16 |
4 |
3 |
9 |
73 |
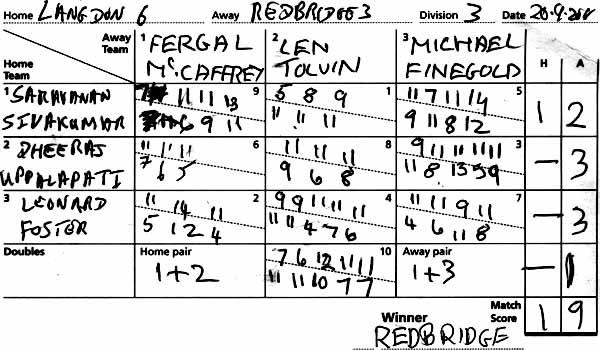
| Redbridge 3 |
16 |
6 |
3 |
7 |
72 |
| Langdon 6 |
16 |
0 |
2 |
14 |
50 |
| Division 3 2011/12 Leading Player Averages | |||||||||
| (Played 50% or more, Average 50% or more) | |||||||||
| First Name | Surname | Team |
P |
W |
L |
Percent | |||
| Richard | Feder | Mossford 8 |
42 |
38 |
4 |
90.48% |
|||
| Rod | Cadywould | Rhodium |
38 |
32 |
6 |
84.21% |
|||
| Oliver | Pink | Mossford 7 |
33 |
26 |
7 |
78.79% |
|||
| Damanjeet | Singh | Langdon 5 |
24 |
18 |
6 |
75.00% |
|||
| David | Adeleye | Heathcote 5 |
42 |
29 |
13 |
69.05% |
|||
| Wing | Lai | Redbridge 2 |
26 |
18 |
8 |
69.23% |
|||
| Andrew | Petrou | Redbridge 2 |
25 |
17 |
8 |
68.00% |
|||
| Chu | Soon | Heathcote 6 |
48 |
32 |
16 |
66.67% |
|||
| Fergal | McCaffrey | Redbridge 3 |
36 |
22 |
14 |
61.11% |
|||
| Sulrata | Mukherjee | Heathcote 5 |
42 |
25 |
17 |
59.52% |
|||
| Joan | Donovan | Rhodium |
26 |
15 |
11 |
57.69% |
|||
| Graeme | Wilson | Redbridge 2 |
23 |
13 |
10 |
56.52% |
|||
| Ivan | Cvetkov | Langdon 5 |
27 |
15 |
12 |
55.56% |
|||
| Chris | Seymour | Langdon 5 |
24 |
12 |
12 |
50.00% |
|||
| Division 3 2011/12 Results Grid - as at 4th April 2012 (FINAL) | |||||||||
| Teams | Heathcote 5 | Heathcote 6 | Langdon 5 | Langdon 6 | Mossford 7 | Mossford 8 | Redbridge 2 | Redbridge 3 | Rhodium |
|
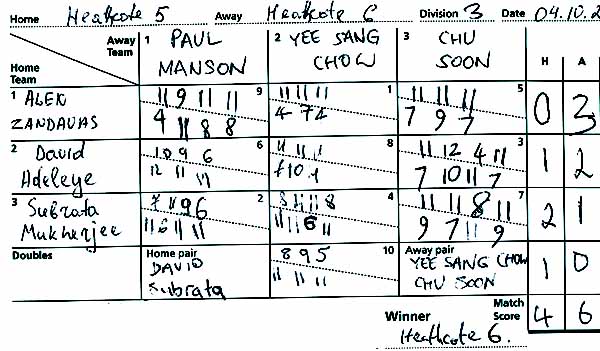
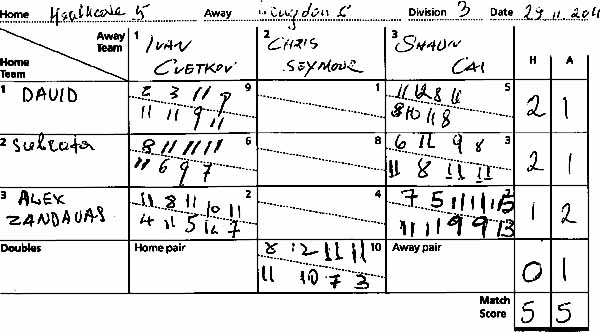
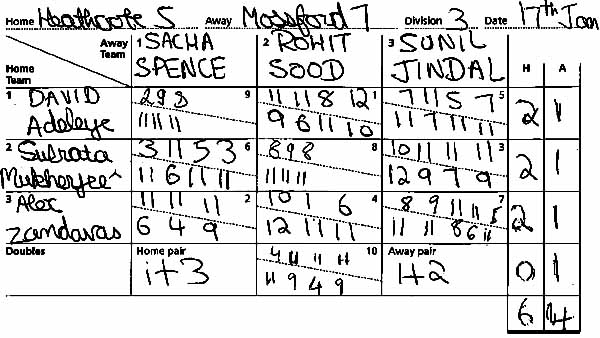
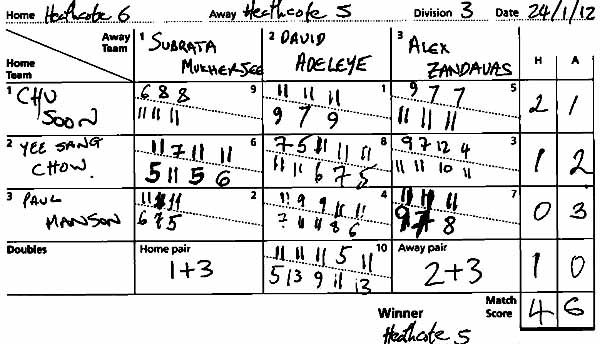
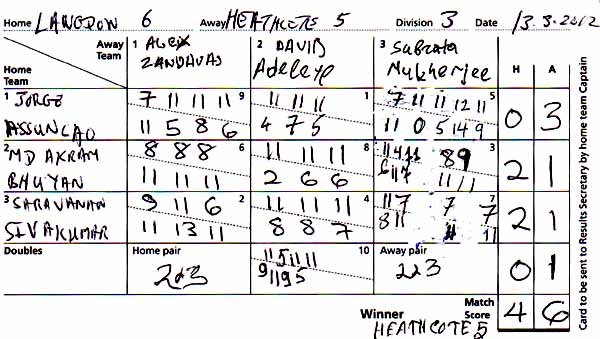
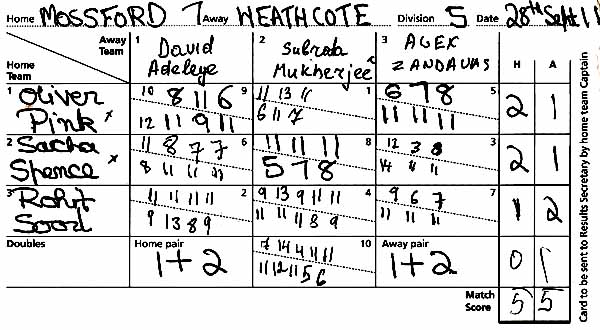
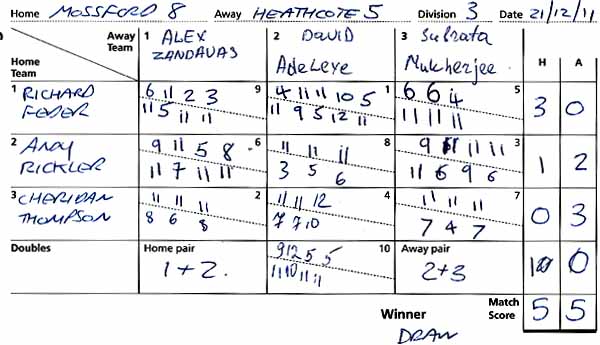
Heathcote 5 |
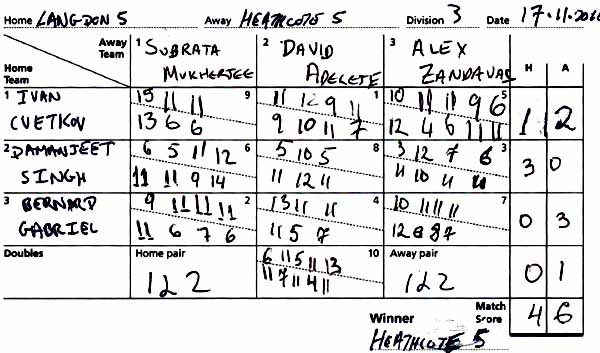
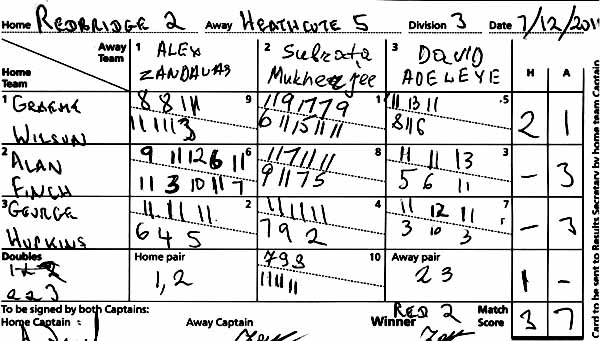
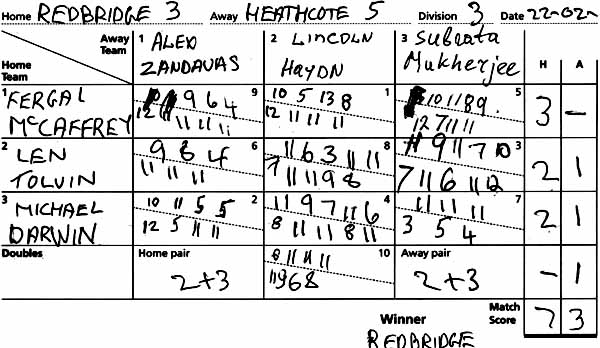
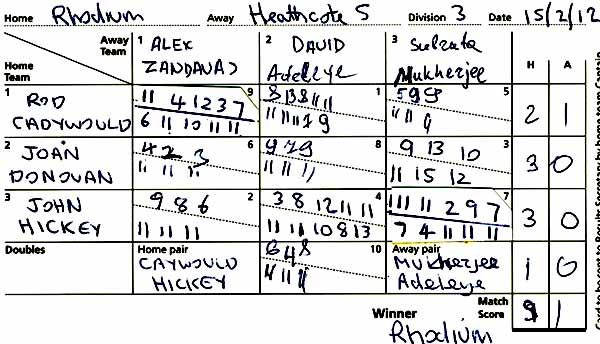
4-6 | 7-3 | 5-5 | 6-4 | 5-5 | 6-4 | 7-33 | 7-31 | |
|
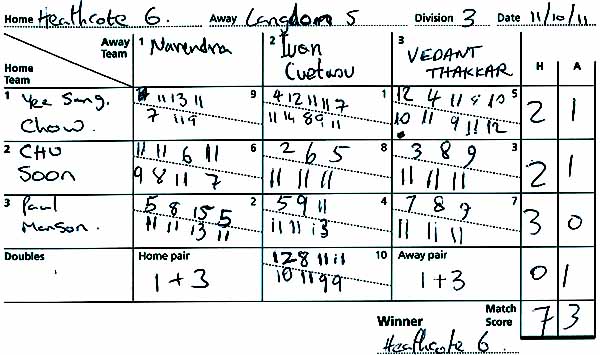
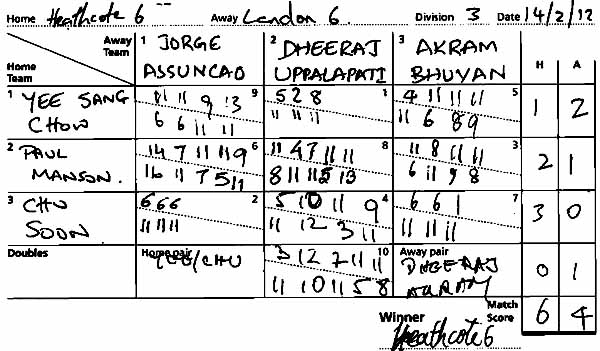
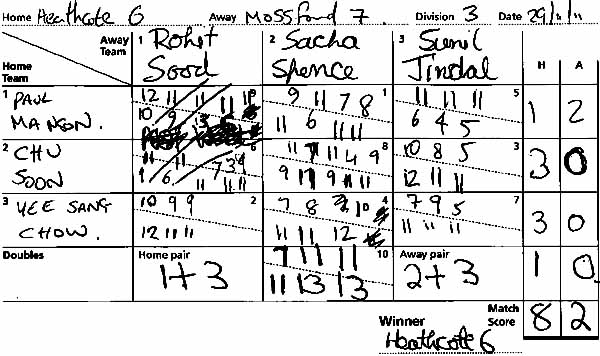
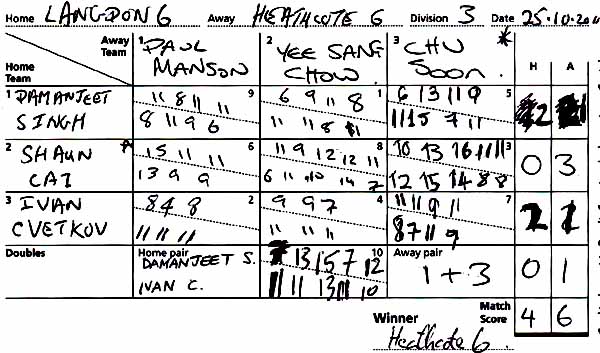
Heathcote 6 |
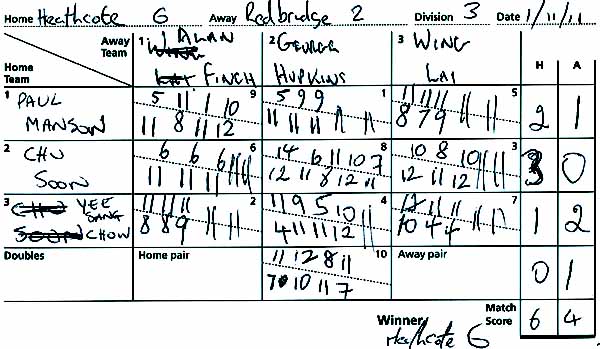
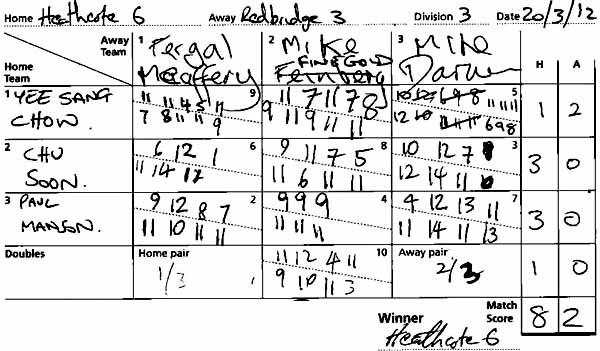
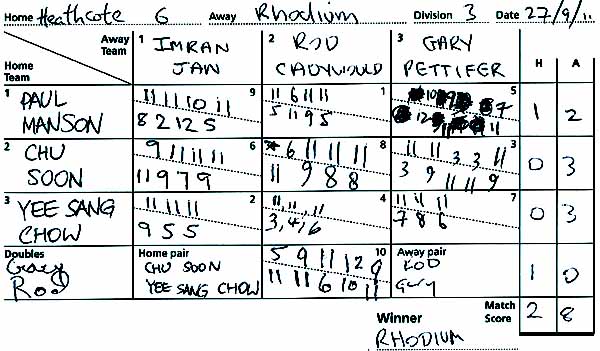
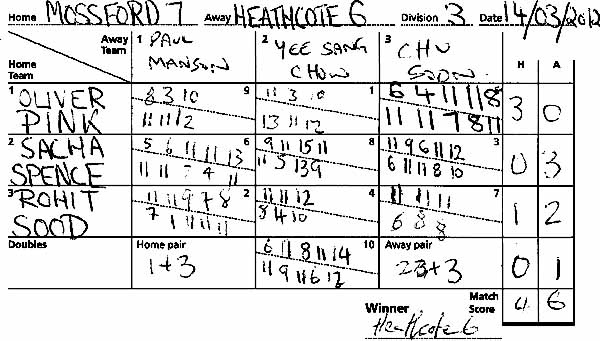
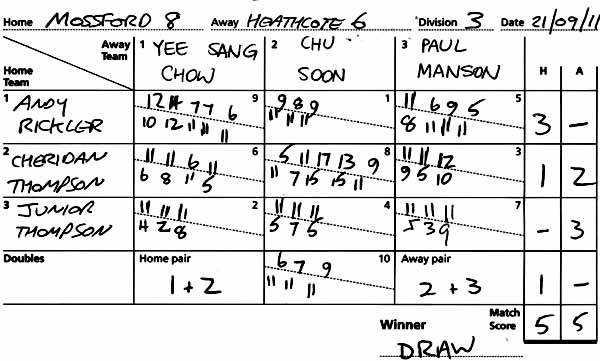
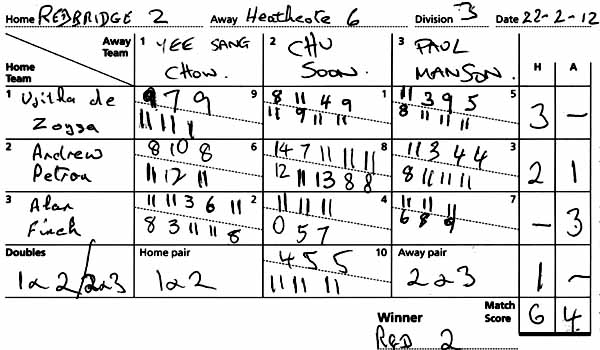
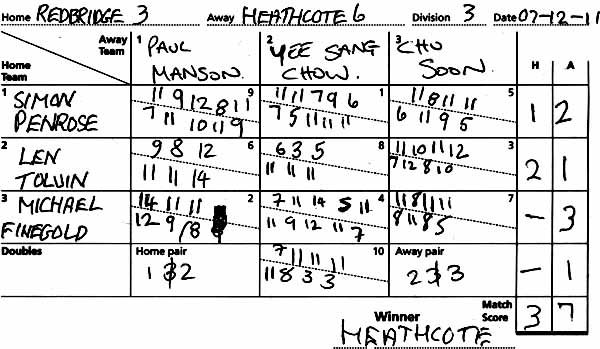
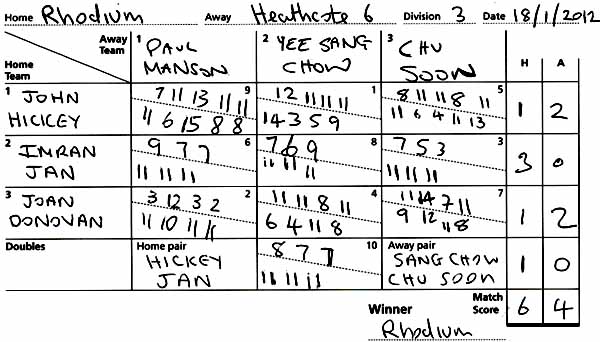
4-6 | 7-3 | 6-4 | 8-2 | 6-46 | 6-4 | 8-27 | 2-8 | |
|
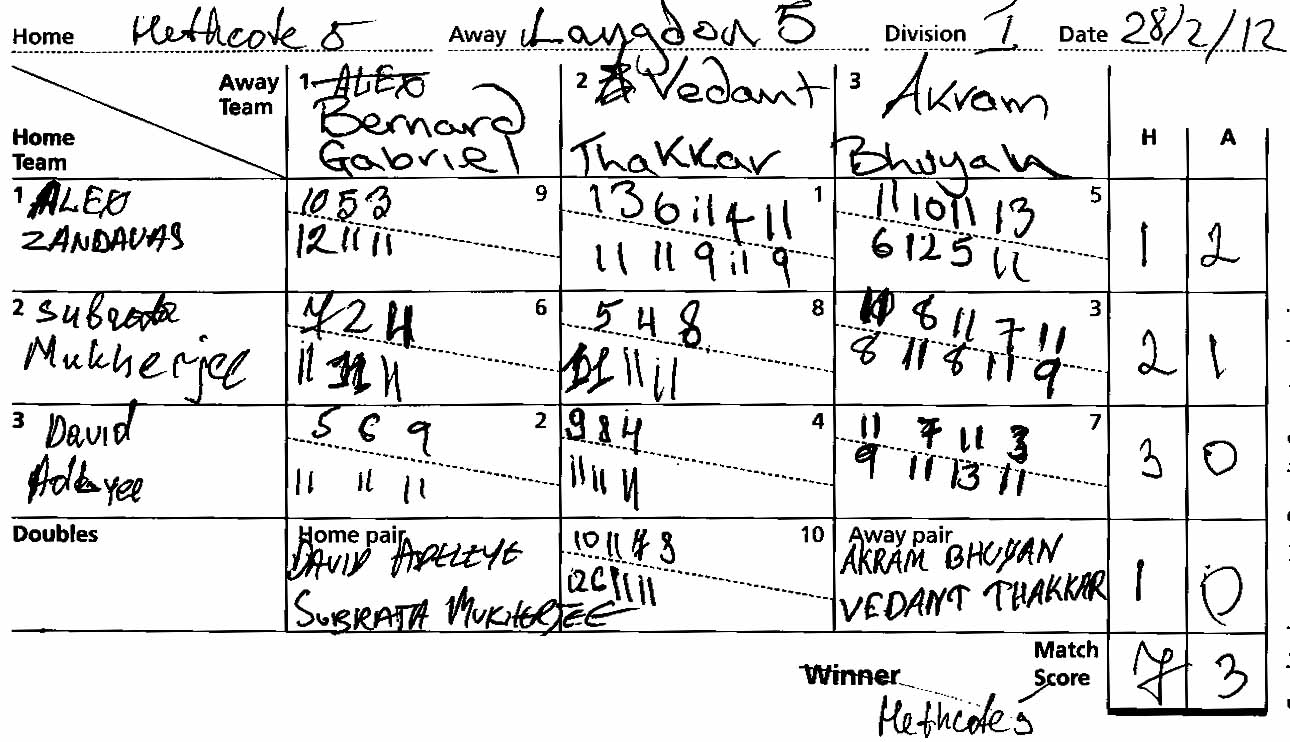
Langdon 5 |
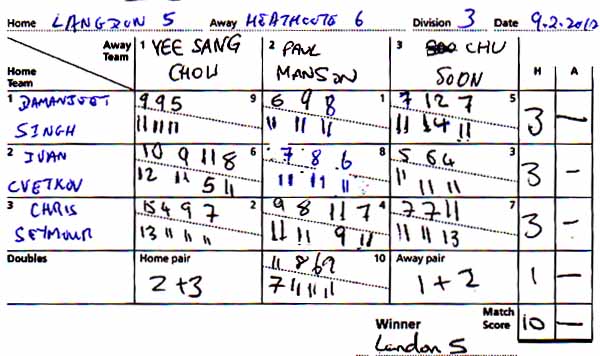
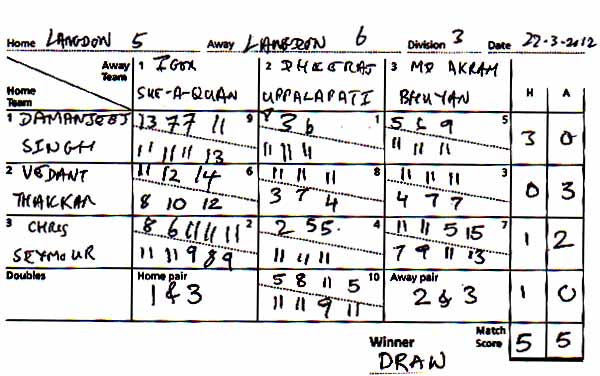
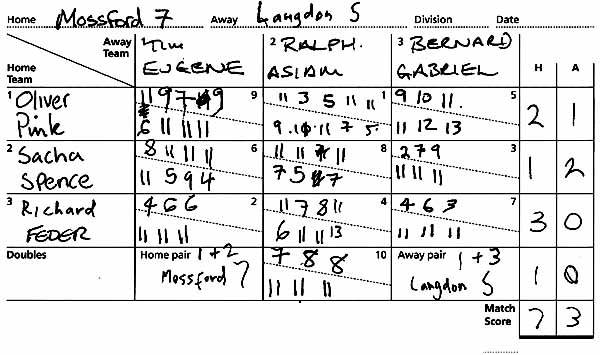
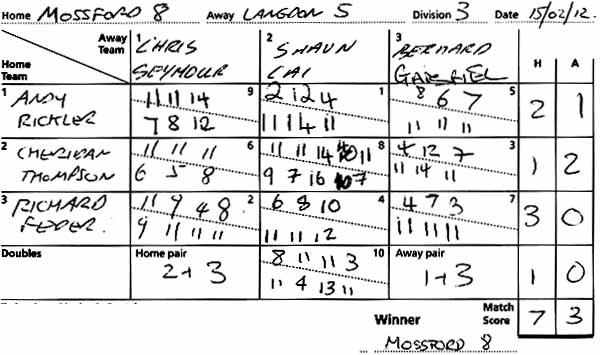
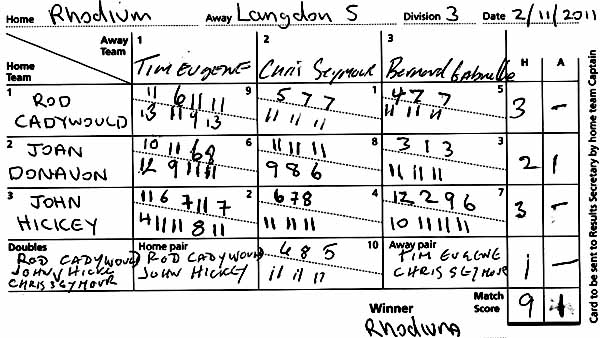
4-6 | 10-0 | 5-5 | 5-5 | 4-6 | 1-9 | 7-3 | 6-4 | |
|
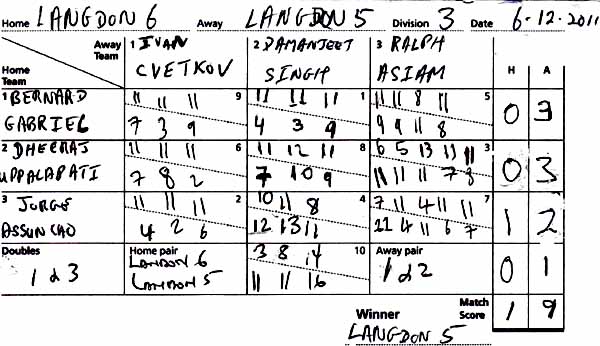
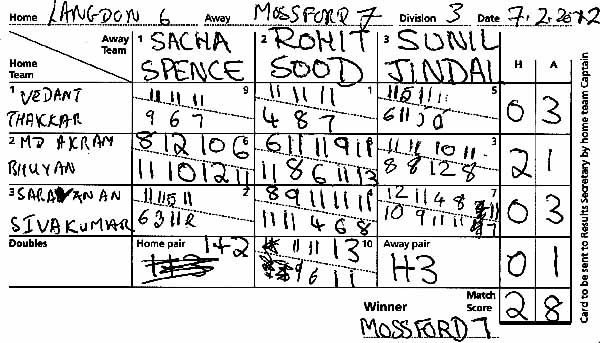
Langdon 6 |
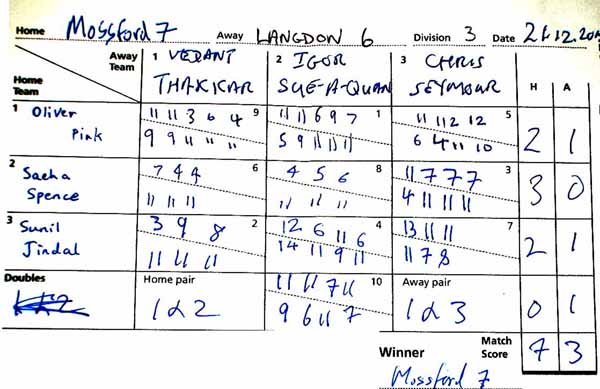
4-6 | 4-6 | 1-95 | 2-8 | 3-7 | 4-6 | 1-9 | 3-7 | |
|
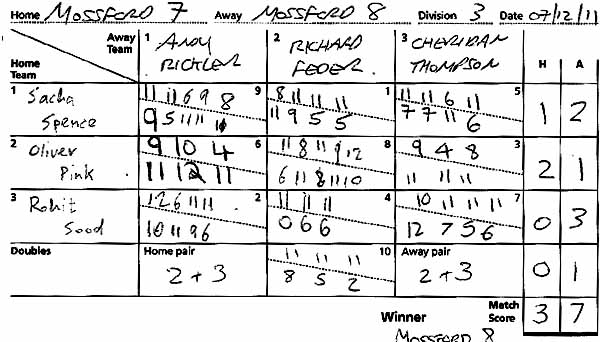
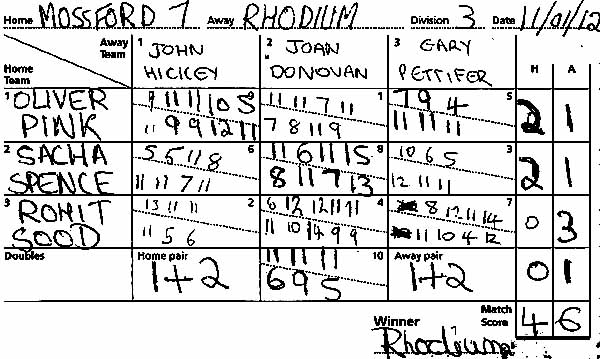
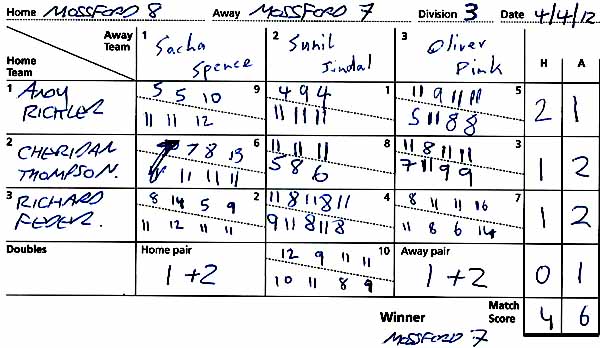
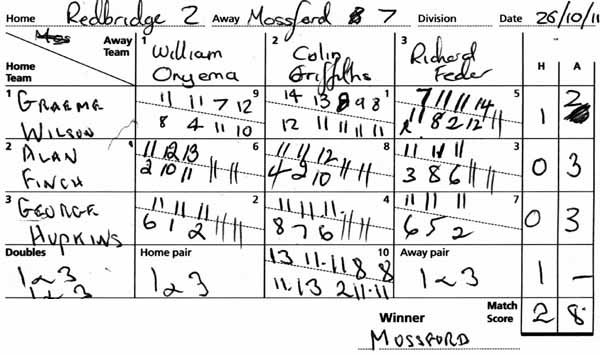
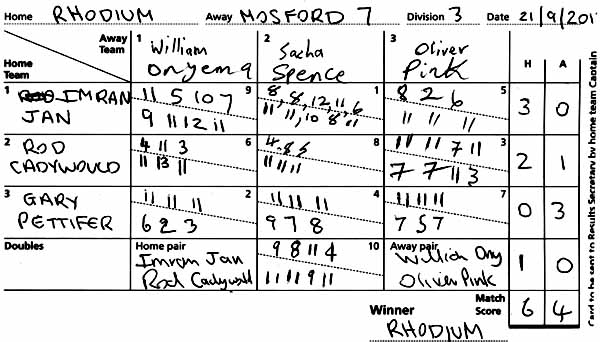
Mossford 7 |
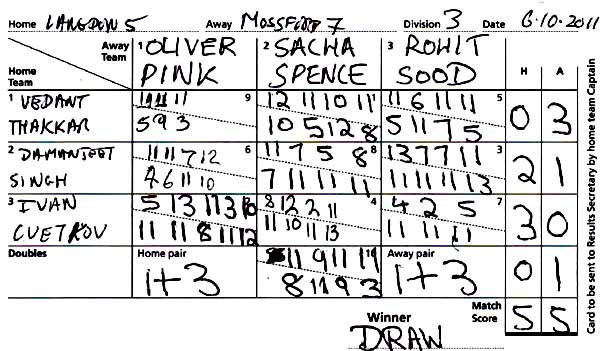
5-5 | 4-6 | 7-3 | 7-3 | 3-7 | 5-5 | 5-5 | 4-6 | |
|
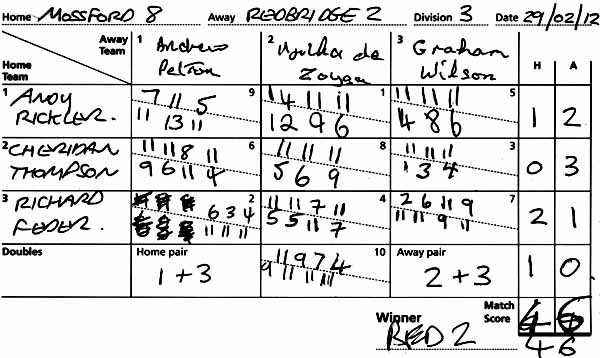
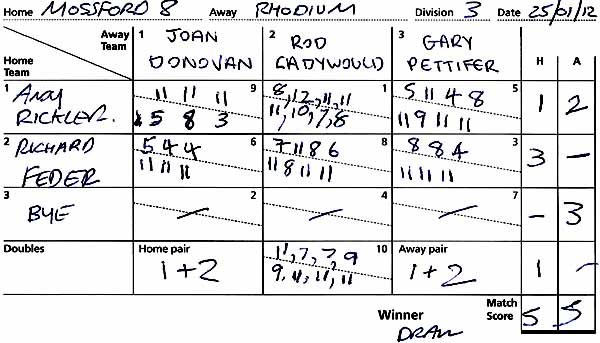
Mossford 8 |
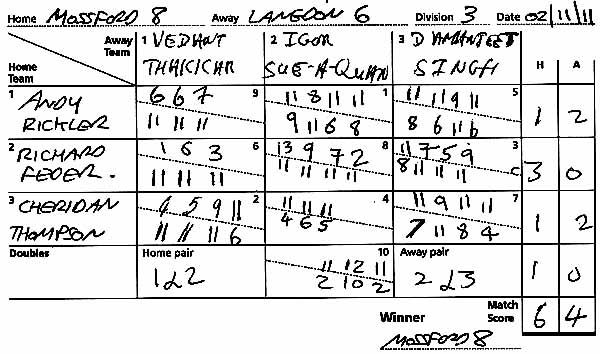
5-5 | 5-5 | 7-3 | 6-42 | 4-6 | 4-6 | 5-5 | 5-5 | |
|
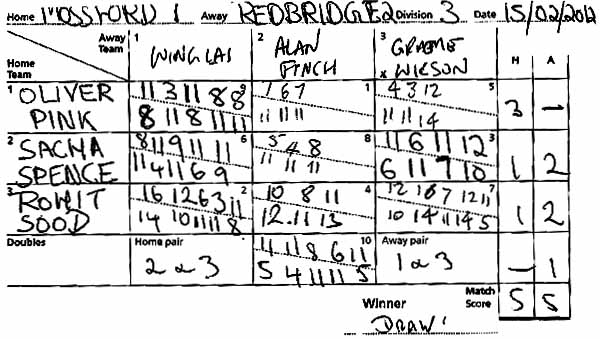
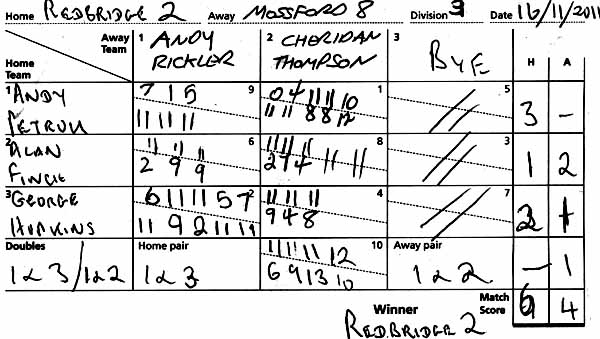
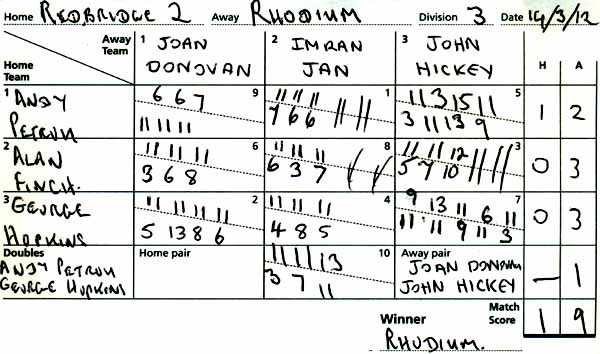
Redbridge 2 |
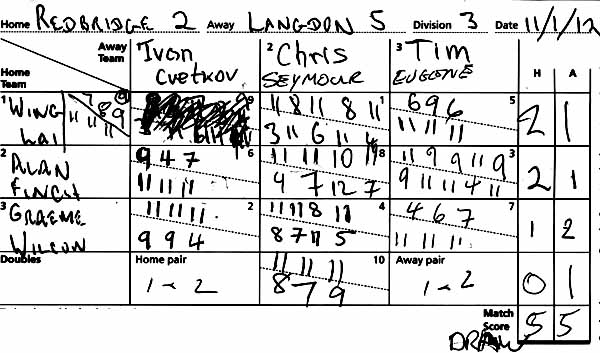
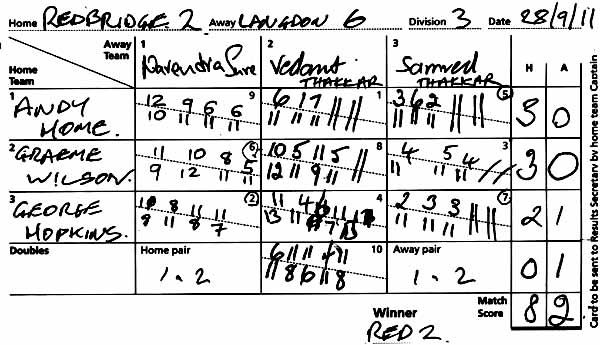
3-7 | 6-4 | 5-5 | 8-2 | 2-8 | 6-4 | 4-6 | 1-9 | |
|
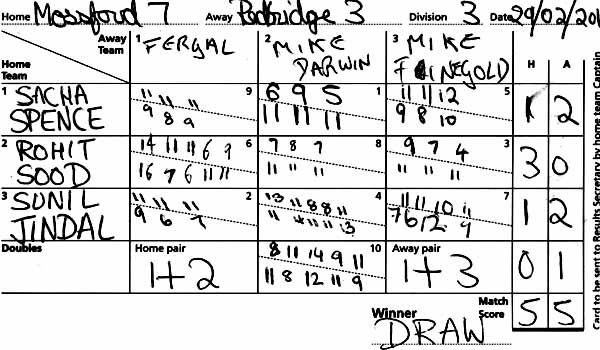
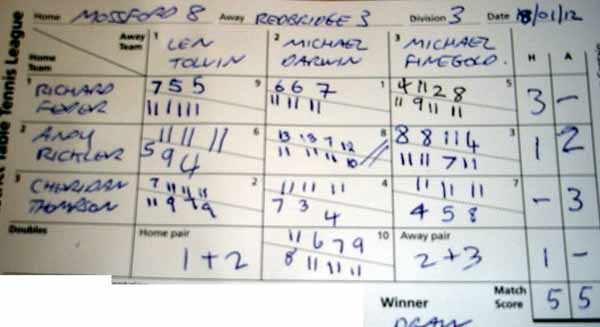
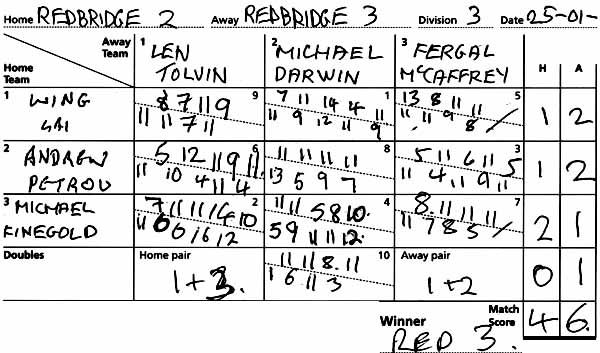
Redbridge 3 |
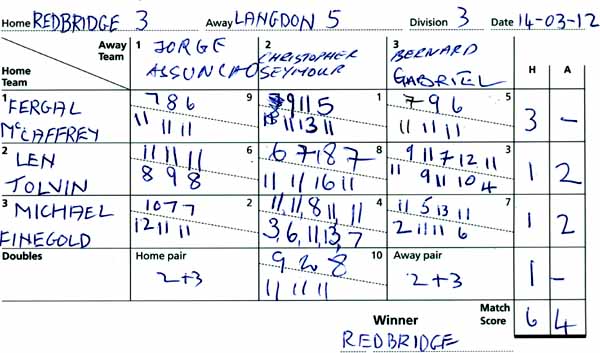
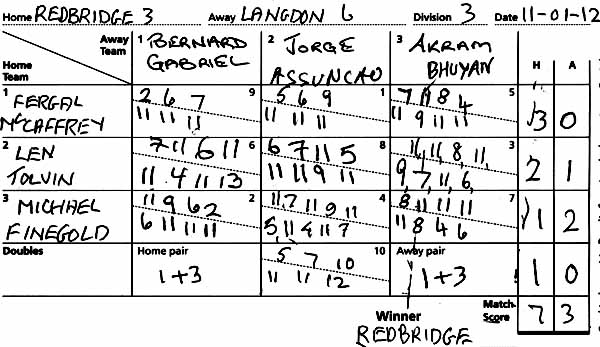
7-3 | 3-7 | 6-4 | 7-3 | 2-84 | 6-4 | 1-9 | 5-5 | |
|
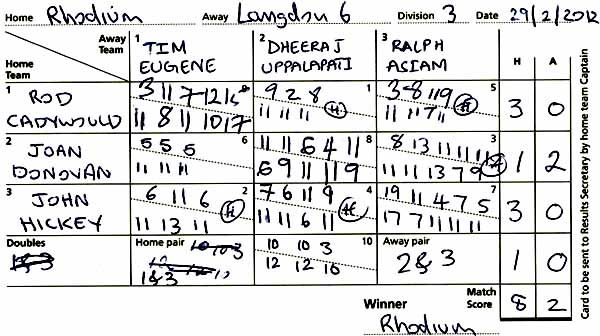
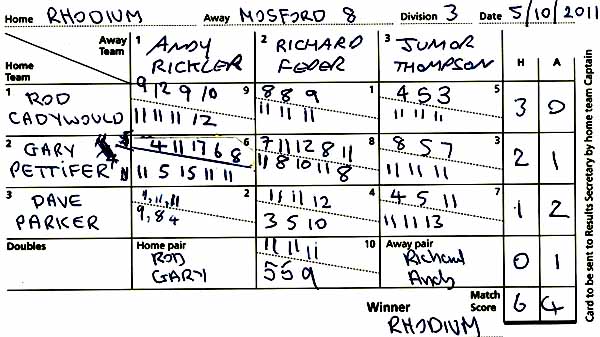
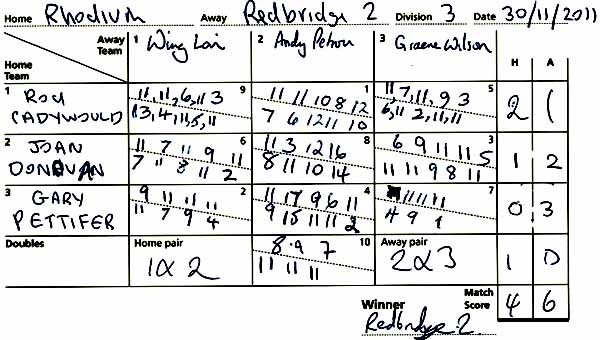
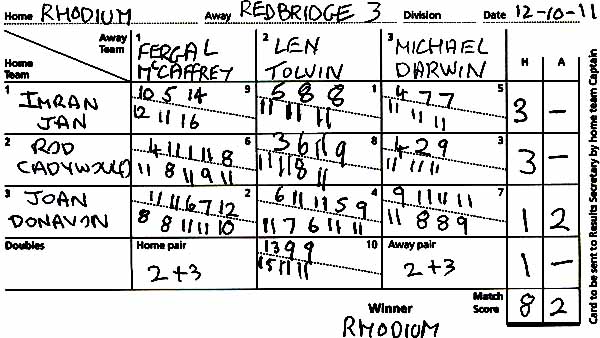
Rhodium |
9-1 | 6-4 | 9-1 | 8-2 | 6-4 | 6-4 | 4-6 | 8-2 | |
|
1 - Game 4 - sets 4 & 5 scored the wrong way round. 2 - Game 2 - was won by home player 3-1 and doubles was Home win 3-0. 3 - Game 4 - sets 3 & 4 scored the wrong way round. 4 - Home team was Redbridge 3! 5 - Doubles were won by Langdon 5 - scored the wrong way round. 6 - Doubles pairings were 2+3 v 1+2 and match was played in 2012! 7 - Doubles was scored the wrong way round - won by Heathcote 6. |
|||||||||
|
P-p = Postponed Games, ?? = Awaiting Card, * = Late Card, != Walkover. The home teams are on the left, and the away teams are at the top, home team score shown first. Dates shown are games scheduled for the week commencing on the Monday. |
|||||||||
|
Division 3 2011/12 Player Averages by Team by Games Played |
||||||
| First Name | Surname | Team |
P |
W |
L |
Percent |
| Alex | Zandavas | Heathcote 5 |
45 |
12 |
33 |
26.67% |
| Sulrata | Mukherjee | Heathcote 5 |
42 |
25 |
17 |
59.52% |
| David | Adeleye | Heathcote 5 |
42 |
29 |
13 |
69.05% |
| Lincoln | Haydn | Heathcote 5 |
3 |
1 |
2 |
33.33% |
| Fred | Alldritt | Heathcote 5 |
3 |
3 |
0 |
100.00% |
| DOUBLES | Heathcote 5 |
16 |
7 |
9 |
43.75% |
|
| WALKOVERS | Heathcote 5 |
9 |
9 |
0 |
100.00% |
|
| Heathcote 5 Total |
160 |
86 |
74 |
53.75% |
||
| Yee Sang | Chow | Heathcote 6 |
48 |
22 |
26 |
45.83% |
| Paul | Manson | Heathcote 6 |
48 |
23 |
25 |
47.92% |
| Chu | Soon | Heathcote 6 |
48 |
32 |
16 |
66.67% |
| DOUBLES | Heathcote 6 |
16 |
8 |
8 |
50.00% |
|
| WALKOVERS | Heathcote 6 |
0 |
0 |
0 |
||
| Heathcote 6 Total |
160 |
85 |
75 |
53.13% |
||
| Ivan | Cvetkov | Langdon 5 |
27 |
15 |
12 |
55.56% |
| Chris | Seymour | Langdon 5 |
24 |
12 |
12 |
50.00% |
| Damanjeet | Singh | Langdon 5 |
24 |
18 |
6 |
75.00% |
| Bernard | Gabriel | Langdon 5 |
18 |
3 |
15 |
16.67% |
| Vedant | Thakkar | Langdon 5 |
14 |
1 |
13 |
7.14% |
| Tim | Eugene | Langdon 5 |
9 |
1 |
8 |
11.11% |
| Ralph | Asiam | Langdon 5 |
6 |
4 |
2 |
66.67% |
| Jorge | Assuncao | Langdon 5 |
3 |
1 |
2 |
33.33% |
| Shaun | Cai | Langdon 5 |
3 |
1 |
2 |
33.33% |
| Akram | Bhuyan | Langdon 5 |
3 |
2 |
1 |
66.67% |
| Kwaku | Ampofo | Langdon 5 |
3 |
2 |
1 |
66.67% |
| Narendra | Sure | Langdon 5 |
3 |
2 |
1 |
66.67% |
| Dheeraj | Uppalapati | Langdon 5 |
2 |
0 |
2 |
0.00% |
| Saravanan | Sivakumar | Langdon 5 |
2 |
1 |
1 |
50.00% |
| DOUBLES | Langdon 5 |
16 |
7 |
9 |
43.75% |
|
| WALKOVERS | Langdon 5 |
3 |
3 |
0 |
100.00% |
|
| Langdon 5 Total |
160 |
73 |
87 |
45.63% |
||
| Dheeraj | Uppalapati | Langdon 6 |
24 |
4 |
20 |
16.67% |
| Akram | Bhuyan | Langdon 6 |
18 |
11 |
7 |
61.11% |
| Vedant | Thakkar | Langdon 6 |
15 |
0 |
15 |
0.00% |
| Jorge | Assuncao | Langdon 6 |
15 |
5 |
10 |
33.33% |
| Saravanan | Sivakumar | Langdon 6 |
15 |
7 |
8 |
46.67% |
| Shaun | Cai | Langdon 6 |
9 |
3 |
6 |
33.33% |
| Igor | Sue-A-Quan | Langdon 6 |
9 |
4 |
5 |
44.44% |
| Bernard | Gabriel | Langdon 6 |
6 |
0 |
6 |
0.00% |
| Damanjeet | Singh | Langdon 6 |
6 |
4 |
2 |
66.67% |
| Ivan | Cvetkov | Langdon 6 |
6 |
4 |
2 |
66.67% |
| Leonard | Foster | Langdon 6 |
3 |
0 |
3 |
0.00% |
| Samved | Thakkar | Langdon 6 |
3 |
0 |
3 |
0.00% |
| Tim | Eugene | Langdon 6 |
3 |
0 |
3 |
0.00% |
| Narendra | Sure | Langdon 6 |
3 |
1 |
2 |
33.33% |
| Ralph | Asiam | Langdon 6 |
3 |
1 |
2 |
33.33% |
| Chris | Seymour | Langdon 6 |
3 |
2 |
1 |
66.67% |
| DOUBLES | Langdon 6 |
16 |
4 |
12 |
25.00% |
|
| WALKOVERS | Langdon 6 |
3 |
0 |
3 |
0.00% |
|
| Langdon 6 Total |
160 |
50 |
110 |
31.25% |
||
| Sacha | Spence | Mossford 7 |
45 |
17 |
28 |
37.78% |
| Rohit | Sood | Mossford 7 |
33 |
14 |
19 |
42.42% |
| Oliver | Pink | Mossford 7 |
33 |
26 |
7 |
78.79% |
| Sunil | Jindal | Mossford 7 |
18 |
10 |
8 |
55.56% |
| William | Onyema | Mossford 7 |
6 |
4 |
2 |
66.67% |
| Richard | Feder | Mossford 7 |
6 |
6 |
0 |
100.00% |
| Colin | Griffiths | Mossford 7 |
3 |
2 |
1 |
66.67% |
| DOUBLES | Mossford 7 |
16 |
6 |
10 |
37.50% |
|
| WALKOVERS | Mossford 7 |
0 |
0 |
0 |
||
| Mossford 7 Total |
160 |
85 |
75 |
53.13% |
||
| Cheridan | Thompson | Mossford 8 |
42 |
13 |
29 |
30.95% |
| Richard | Feder | Mossford 8 |
42 |
38 |
4 |
90.48% |
| Andy | Rickler | Mossford 8 |
39 |
17 |
22 |
43.59% |
| Junior | Thompson | Mossford 8 |
6 |
0 |
6 |
0.00% |
| Sunil | Jindal | Mossford 8 |
3 |
1 |
2 |
33.33% |
| DOUBLES | Mossford 8 |
16 |
13 |
3 |
81.25% |
|
| WALKOVERS | Mossford 8 |
12 |
0 |
12 |
0.00% |
|
| Mossford 8 Total |
160 |
82 |
78 |
51.25% |
||
| Alan | Finch | Redbridge 2 |
26 |
3 |
23 |
11.54% |
| Wing | Lai | Redbridge 2 |
26 |
18 |
8 |
69.23% |
| Andrew | Petrou | Redbridge 2 |
25 |
17 |
8 |
68.00% |
| George | Hopkins | Redbridge 2 |
23 |
4 |
19 |
17.39% |
| Graeme | Wilson | Redbridge 2 |
23 |
13 |
10 |
56.52% |
| Ujitha | DeZoysa | Redbridge 2 |
9 |
9 |
0 |
100.00% |
| Michael | Finegold | Redbridge 2 |
3 |
2 |
1 |
66.67% |
| Andrew | Home | Redbridge 2 |
3 |
3 |
0 |
100.00% |
| DOUBLES | Redbridge 2 |
16 |
9 |
7 |
56.25% |
|
| WALKOVERS | Redbridge 2 |
6 |
6 |
0 |
100.00% |
|
| Redbridge 2 Total |
160 |
84 |
76 |
52.50% |
||
| Len | Tolvin | Redbridge 3 |
39 |
18 |
21 |
46.15% |
| Fergal | McCaffrey | Redbridge 3 |
36 |
22 |
14 |
61.11% |
| Michael | Finegold | Redbridge 3 |
30 |
9 |
21 |
30.00% |
| Mike | Darwin | Redbridge 3 |
27 |
12 |
15 |
44.44% |
| Simon | Penrose | Redbridge 3 |
3 |
1 |
2 |
33.33% |
| Andrew | Petrou | Redbridge 3 |
3 |
2 |
1 |
66.67% |
| DOUBLES | Redbridge 3 |
16 |
8 |
8 |
50.00% |
|
| WALKOVERS | Redbridge 3 |
6 |
0 |
6 |
0.00% |
|
| Redbridge 3 Total |
160 |
72 |
88 |
45.00% |
||
| Rod | Cadywould | Rhodium |
38 |
32 |
6 |
84.21% |
| Gary | Pettifer | Rhodium |
29 |
7 |
22 |
24.14% |
| Joan | Donovan | Rhodium |
26 |
15 |
11 |
57.69% |
| John | Hickey | Rhodium |
21 |
15 |
6 |
71.43% |
| Imran | Jan | Rhodium |
21 |
20 |
1 |
95.24% |
| Dave | Parker | Rhodium |
6 |
1 |
5 |
16.67% |
| DOUBLES | Rhodium |
16 |
10 |
6 |
62.50% |
|
| WALKOVERS | Rhodium |
3 |
3 |
0 |
100.00% |
|
| Rhodium Total |
160 |
103 |
57 |
64.38% |
||
| Grand Total |
1440 |
720 |
720 |
|||
| Division 3 2011/12 Results Grid - Original Fixture Dates (for reference) | |||||||||
| Teams | Heathcote 5 | Heathcote 6 | Langdon 5 | Langdon 6 | Mossford 7 | Mossford 8 | Redbridge 2 | Redbridge 3 | Rhodium |
|
Heathcote 5 |
03-Oct | 27-Feb | 28-Nov | 16-Jan | 06-Feb | 19-Mar | 31-Oct | 24-Oct | |
|
Heathcote 6 |
23-Jan | 10-Oct | 13-Feb | 28-Nov | 09-Jan | 31-Oct | 19-Mar | 26-Sep | |
|
Langdon 5 |
14-Nov | 06-Feb | 19-Mar | 03-Oct | 24-Oct | 19-Sep | 28-Nov | 20-Feb | |
|
Langdon 6 |
12-Mar | 24-Oct | 05-Dec | 06-Feb | 20-Feb | 16-Jan | 19-Sep | 14-Nov | |
|
Mossford 7 |
26-Sep | 12-Mar | 23-Jan | 10-Oct | 05-Dec | 13-Feb | 27-Feb | 09-Jan | |
|
Mossford 8 |
10-Oct | 19-Sep | 13-Feb | 31-Oct | 19-Mar | 27-Feb | 16-Jan | 23-Jan | |
|
Redbridge 2 |
05-Dec | 20-Feb | 09-Jan | 26-Sep | 24-Oct | 14-Nov | 23-Jan | 12-Mar | |
|
Redbridge 3 |
20-Feb | 05-Dec | 12-Mar | 09-Jan | 14-Nov | 26-Sep | 03-Oct | 06-Feb | |
|
Rhodium |
13-Feb | 16-Jan | 31-Oct | 27-Feb | 19-Sep | 03-Oct | 28-Nov | 10-Oct | |
|
P-p = Postponed Games, ?? = Awaiting Card, * = Late Card, != Walkover. The home teams are on the left, and the away teams are at the top, home team score shown first. Dates shown are games scheduled for the week commencing on the Monday. |
|||||||||
| Division 3 2011/12 Results Grid - Original Fixture Dates (for reference) | ||||||||||
| Teams | A | B | C | D | E | F | G | H | I | J |
| A |
|
05-Dec |
12-Mar |
14-Nov |
20-Feb |
24-Oct |
06-Feb |
03-Oct |
16-Jan |
19-Sep |
| B |
19-Mar |
|
14-Nov |
20-Feb |
24-Oct |
06-Feb |
03-Oct |
16-Jan |
19-Sep |
28-Nov |
| C |
28-Nov |
27-Feb |
|
24-Oct |
06-Feb |
03-Oct |
16-Jan |
19-Sep |
19-Mar |
31-Oct |
| D |
27-Feb |
31-Oct |
13-Feb |
|
03-Oct |
16-Jan |
19-Sep |
19-Mar |
28-Nov |
10-Oct |
| E |
31-Oct |
13-Feb |
10-Oct |
23-Jan |
|
19-Sep |
19-Mar |
28-Nov |
27-Feb |
16-Jan |
| F |
13-Feb |
10-Oct |
23-Jan |
26-Sep |
09-Jan |
|
28-Nov |
27-Feb |
31-Oct |
19-Mar |
| G |
10-Oct |
23-Jan |
26-Sep |
09-Jan |
05-Dec |
12-Mar |
|
31-Oct |
13-Feb |
27-Feb |
| H |
23-Jan |
26-Sep |
09-Jan |
05-Dec |
12-Mar |
14-Nov |
20-Feb |
|
10-Oct |
13-Feb |
| I |
26-Sep |
09-Jan |
05-Dec |
12-Mar |
14-Nov |
20-Feb |
24-Oct |
06-Feb |
|
23-Jan |
| J |
09-Jan |
12-Mar |
20-Feb |
06-Feb |
26-Sep |
05-Dec |
14-Nov |
24-Oct |
03-Oct |
|
|
P-p = Postponed Games, ?? = Awaiting Card, * = Late Card, != Walkover. The home teams are on the left, and the away teams are at the top, home team score shown first. Dates shown are games scheduled for the week commencing on the Monday. |
||||||||||